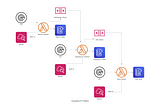
PinnedMemphis MenginTowards Data ScienceHow I Built A Cascading Data Pipeline Based on AWS (Part 1)Automatic, scalable, and powerfulJul 31, 2023Jul 31, 2023
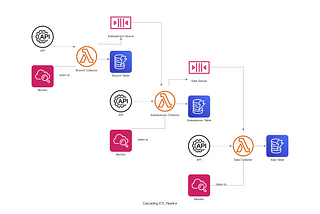
Memphis MenginTowards Data ScienceHow I Built A Cascading Data Pipeline Based on AWS (Part 2)Automatic, scalable, and powerfulAug 25, 2023Aug 25, 2023
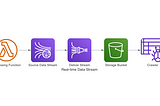
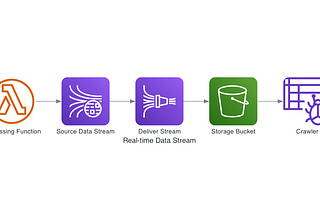
Memphis MenginPlumbers Of Data ScienceA Real-Time Streaming ChannelEffortless solution to transform unstrucutured data to the structuredJul 29, 2023Jul 29, 2023
Memphis MenginTowards AITableau Dashboard Case Study: Investigation into Foreign Player Status between MLS & CSLMy Real-Life Tableau PresentationNov 5, 2021Nov 5, 2021
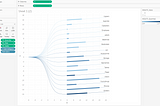
Memphis MenginTowards AIMake Your Dashboard Stand Out — Dendrogam ChartImpress your audience and bosses!Oct 13, 2021Oct 13, 2021
Memphis MenginTowards AIMake Your Dashboard Stand Out — 3D Bar ChartImpress your clients and bosses!Oct 5, 2021Oct 5, 2021
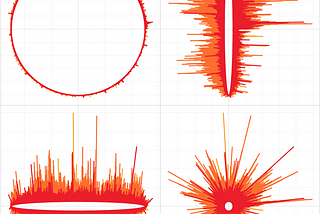
Memphis MenginTowards AIMake Your Dashboard Stand Out — Sunshine ChartImpress your audience and bosses!Sep 20, 20211Sep 20, 20211
Memphis MenginGeek CultureI spent months hunting for a job in my dream industry after graduation, and I know it’s worthyMy journey, my struggles, and my gainsAug 26, 2021Aug 26, 2021
Memphis MenginTowards AIMake Your Dashboard Stand Out — Lollipop ChartImpress your clients and bosses!Aug 20, 2021Aug 20, 2021
Memphis MenginTowards AIMake Your Dashboard Stand Out — Radial Pie Guage ChartImpress your clients and bosses!Aug 4, 2021Aug 4, 2021